 Stephen Orr
What do people think of your app? It’s not always easy to tell. Reviews are hard to trust and surveys are subject to bias. Besides, both of those options leave out other crucial data that can drastically change your business strategies. In order to keep your app and your business alive, you can’t rely on speculation alone. Your company needs to collect data on how people use your app. However, not all data is created equal. If you aren’t careful, the data you collect could be misleading. Follow this guide to improve your app analytics and take your product to the next level.
Why You Need App Analytics
Analytics tools provide valuable insight into the day-to-day operation of your app. Whether you want to learn more about your users, your adds, your sales, or your system’s functionality, app analytics are an absolutely critical component of both app and business maintenance. The importance of effective app analytics cannot be understated.
How it Works
Your app will attract so many unique users over its lifetime that merely predicting behavior won’t be enough. You need to implement systems that automatically track certain behaviors and organize that data into filterable categories. That collect-and-filter process is most effectively accomplished by app analytics tools. While a plethora of analytics solutions are available for developers, the best ones depend upon your specific application. A few app analytics tools stand out as particularly powerful and user-friendly:
Apple App Analytics
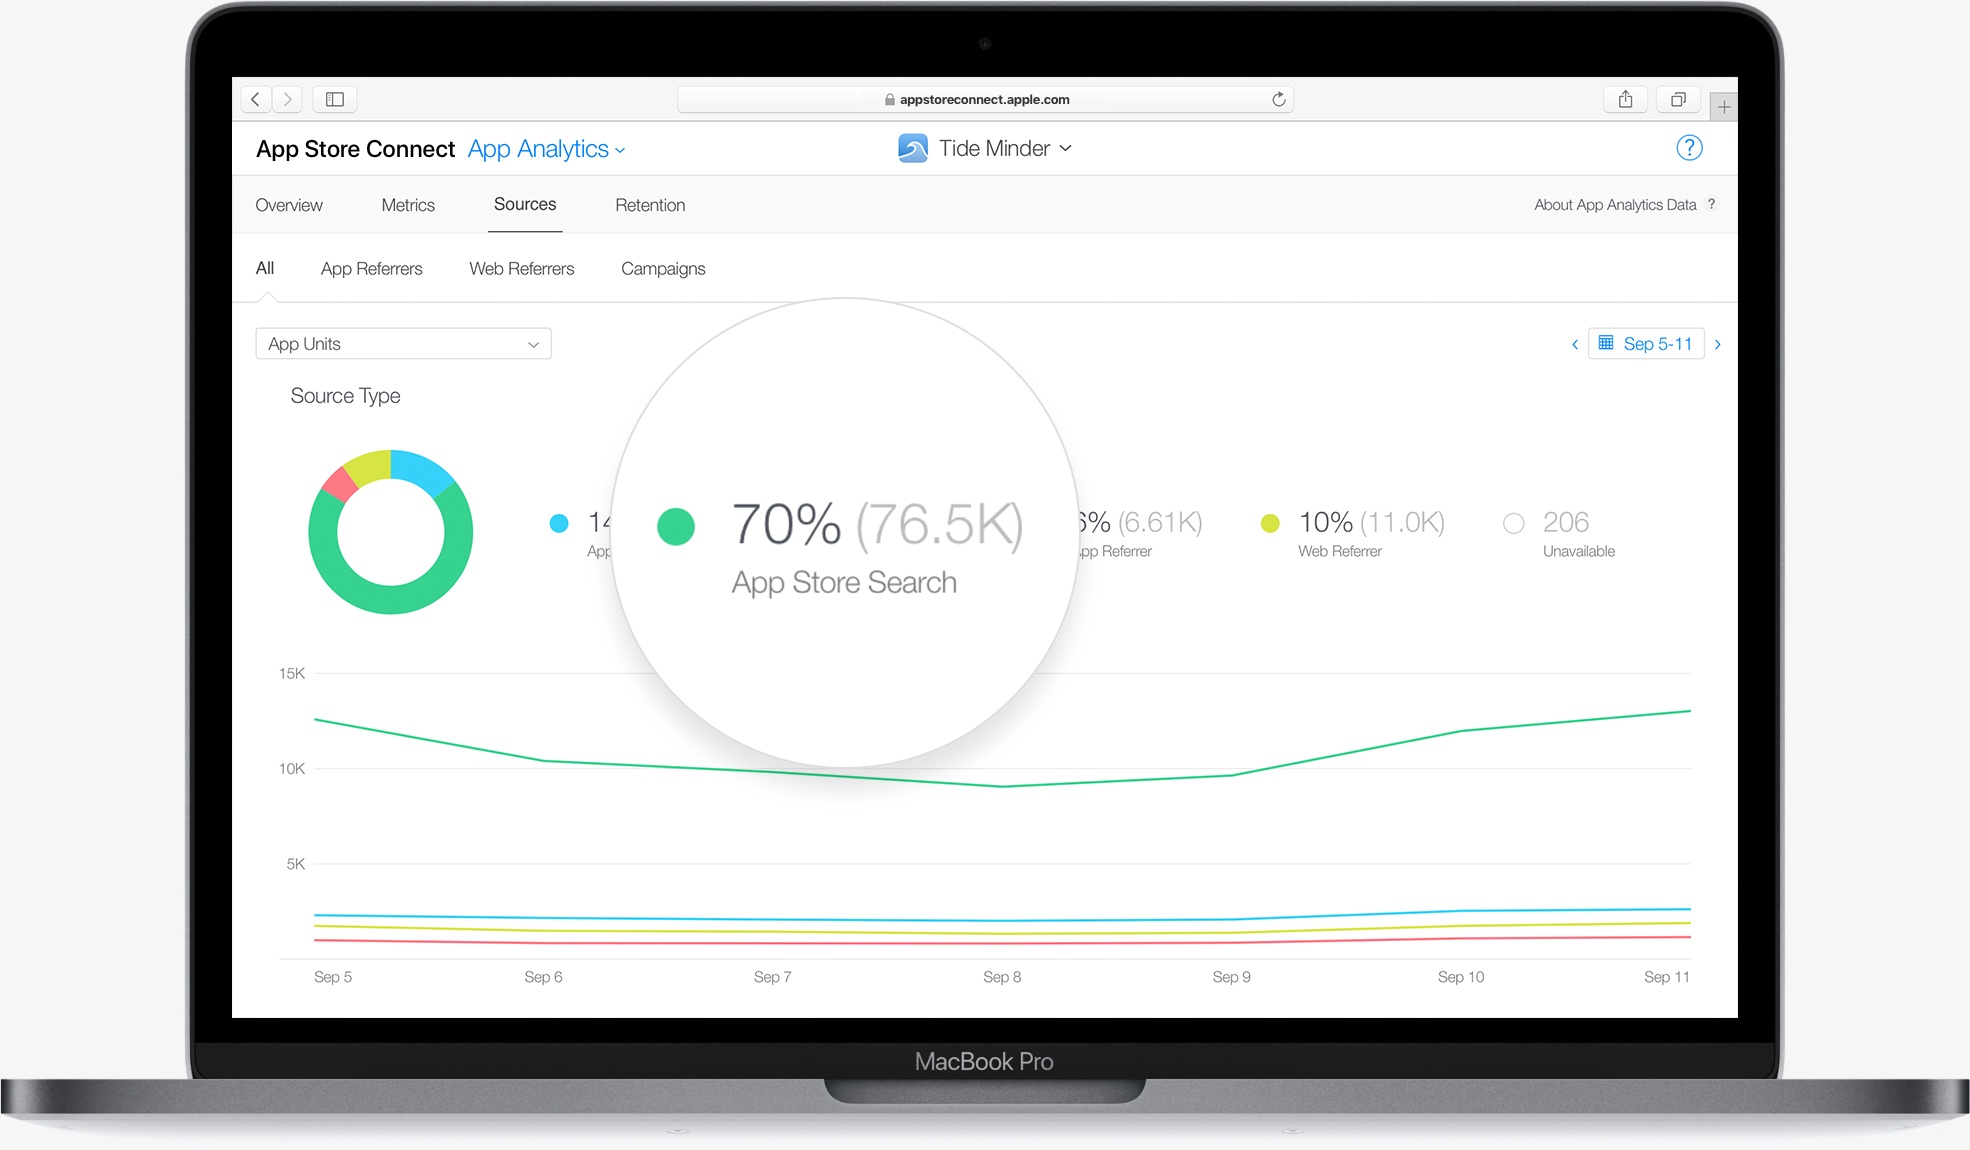
If you are developing a native iOS application, look no further than Apple’s App Analytics. This analytics tool comes with the Apple Developer program and offers a wide variety of useful features. Most notably, the program tracks users with unparalleled precision by identifying them by AppleID instead of device type. As a result, you can obtain exact download details from the app store, such as the date and source of installation.
However, App Analytics only works with iOS devices, so it is not an option for cross-platform applications.
Google Analytics
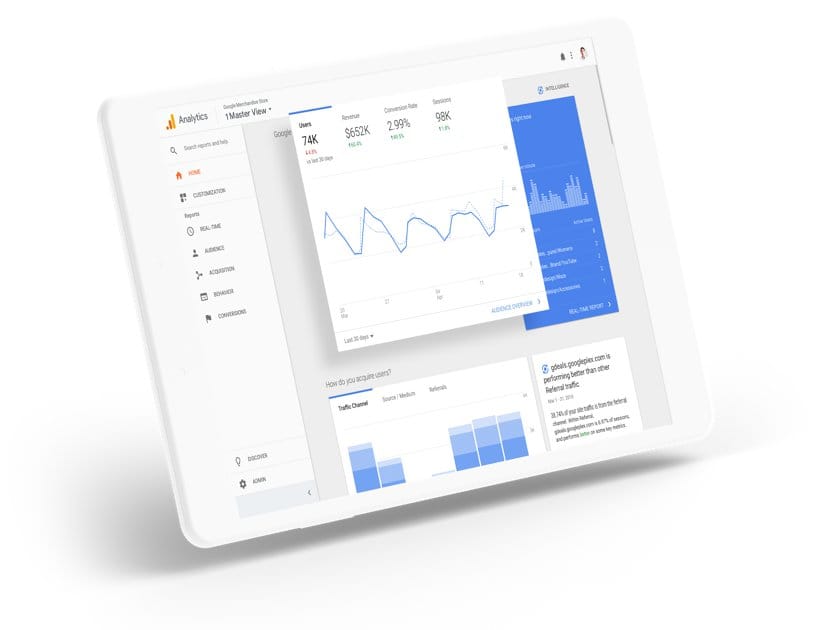
Google Analytics is the gold standard of mobile app data analysis–and it is completely free. It comes with extremely powerful data analysis and visualization tools as well as advanced filters, efficient collection APIs, and automatic insights. And unlike Apple Analytics, Google works with all major platforms. While the interface may be complicated, Google Analytics remains one of the most versatile and powerful app analytics solutions.
Criteo
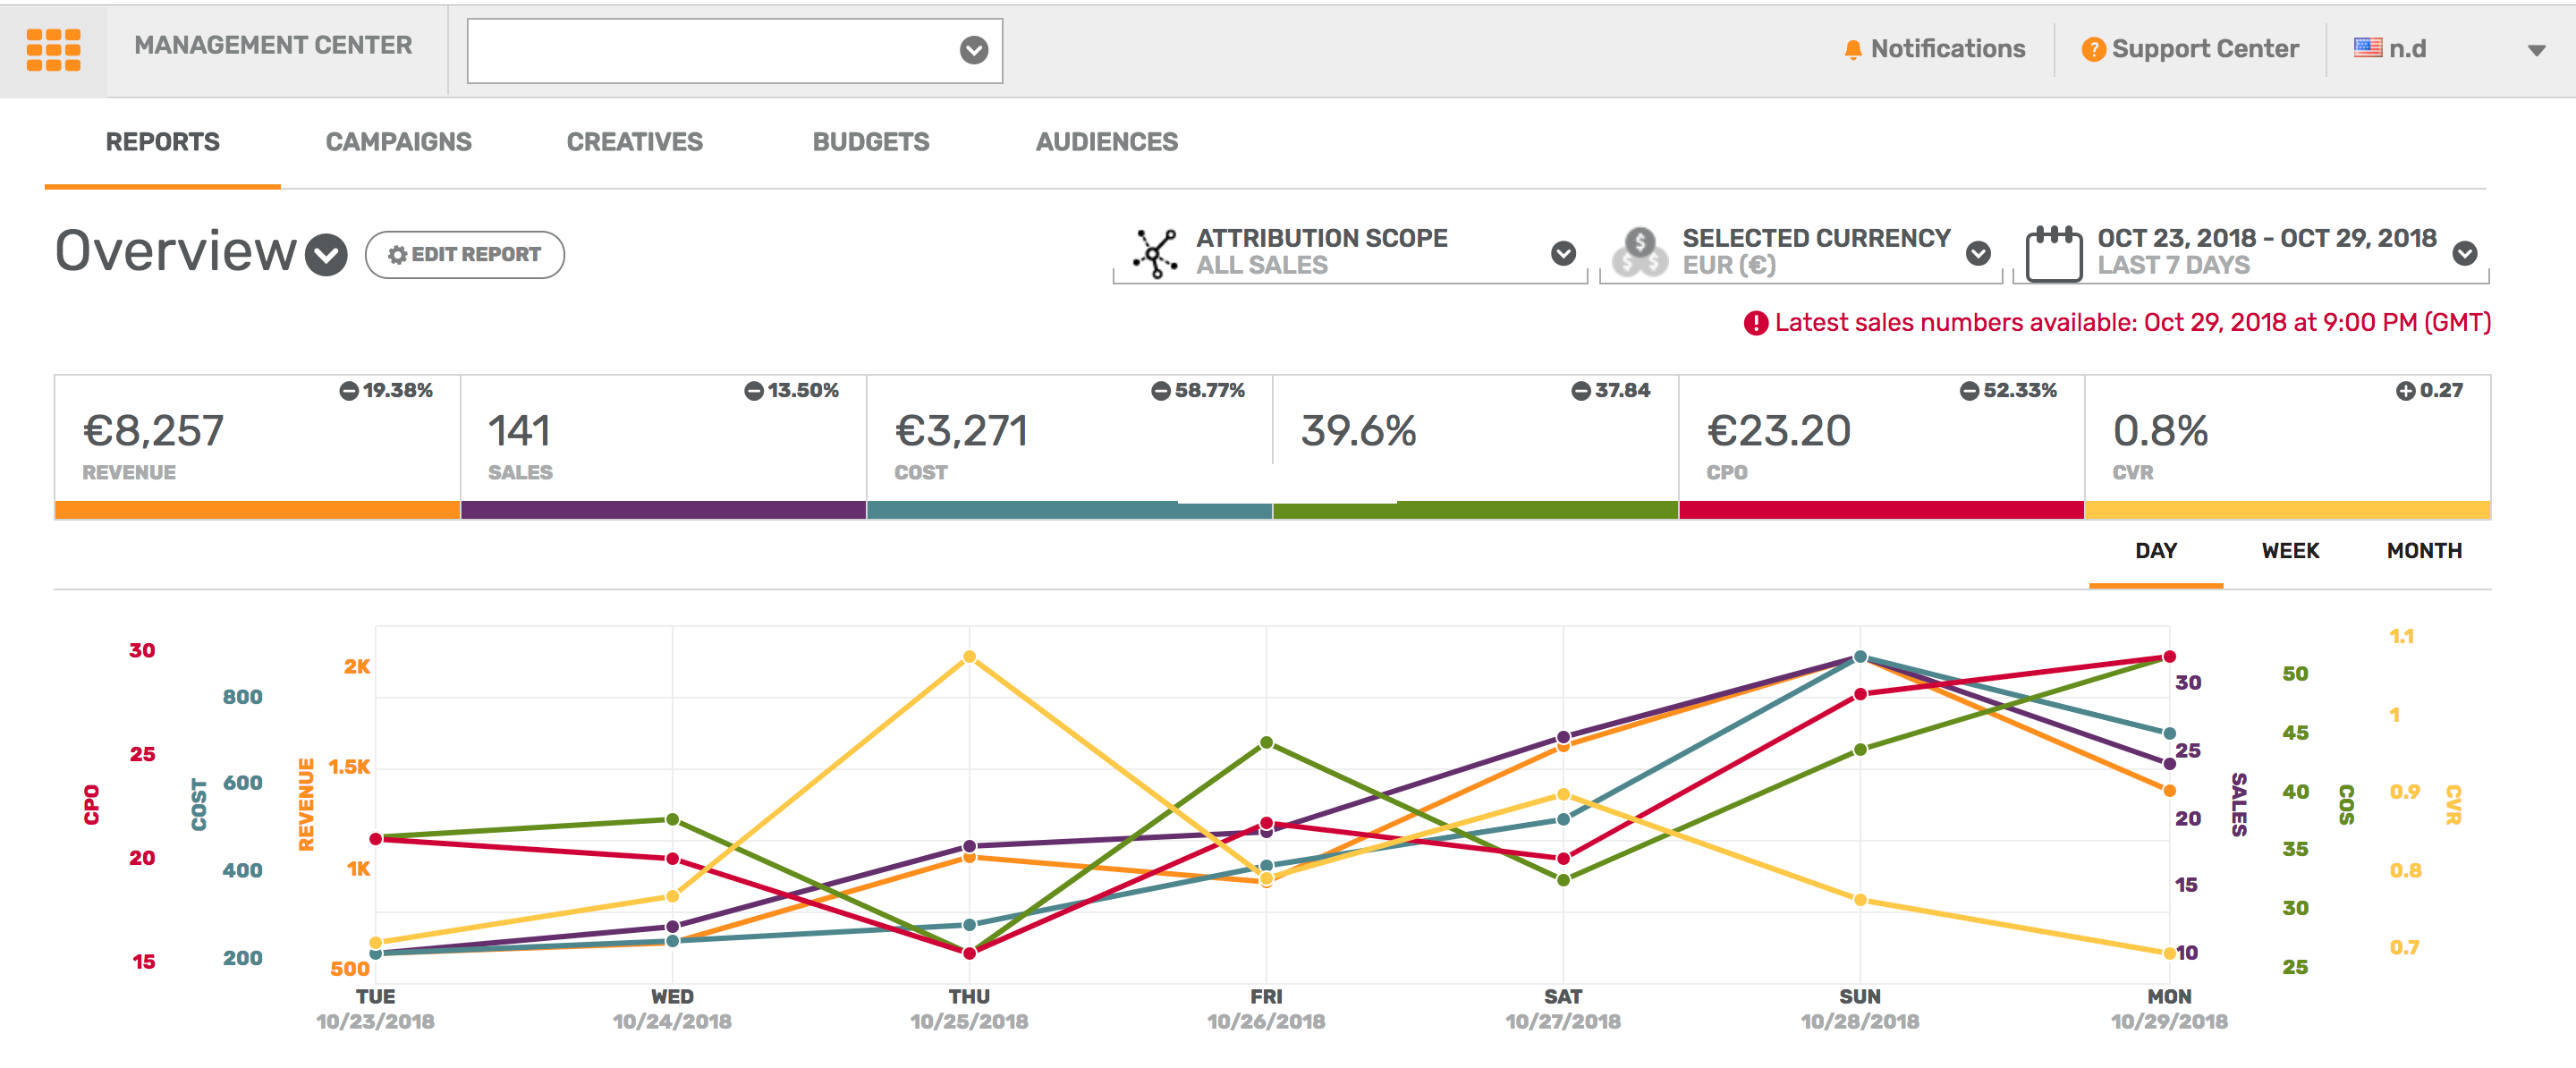
Most of these tools, like Google Analytics, take a broad approach to data analytics. Criteo, on the other hand, hyper-focuses on sales and advertising, making it a popular choice amongst major retail and grocery companies such as Macy’s and Costco. One of their flagship features is the “Shopper Graph,” which measures massive amounts of customer data to predict what your audience wants to buy. It also offers a simple, yet powerful advertising platform with built-in analytics linked to product categories. If your company is developing an eCommerce application, consider Criteo.
Amazon Redshift

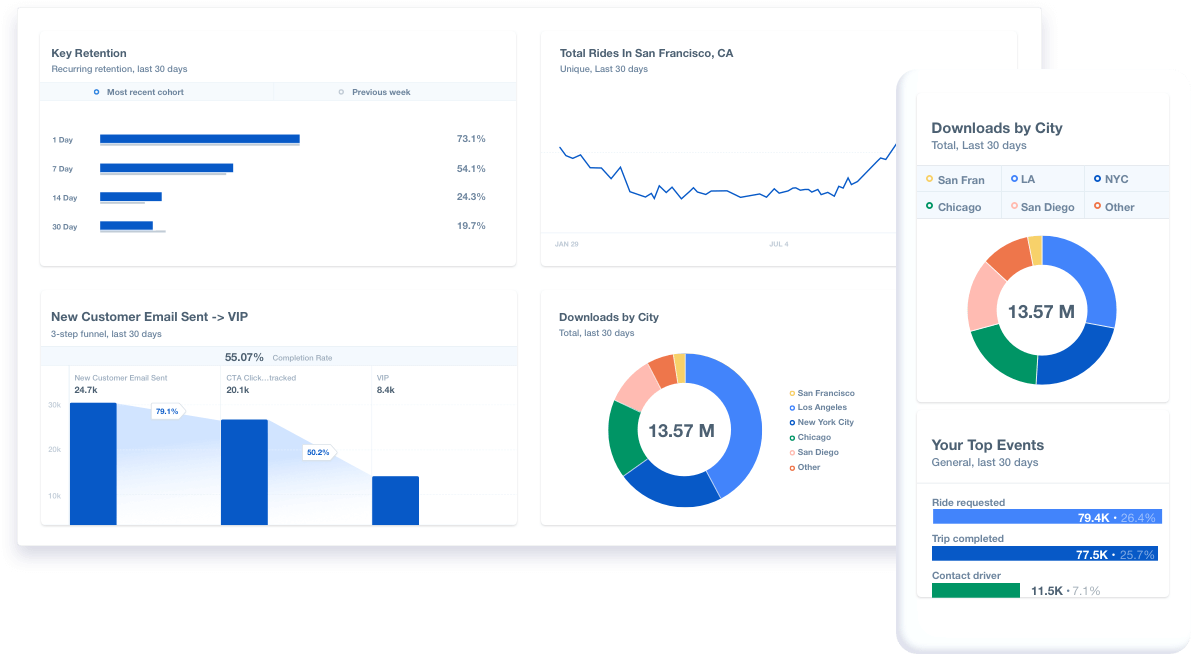
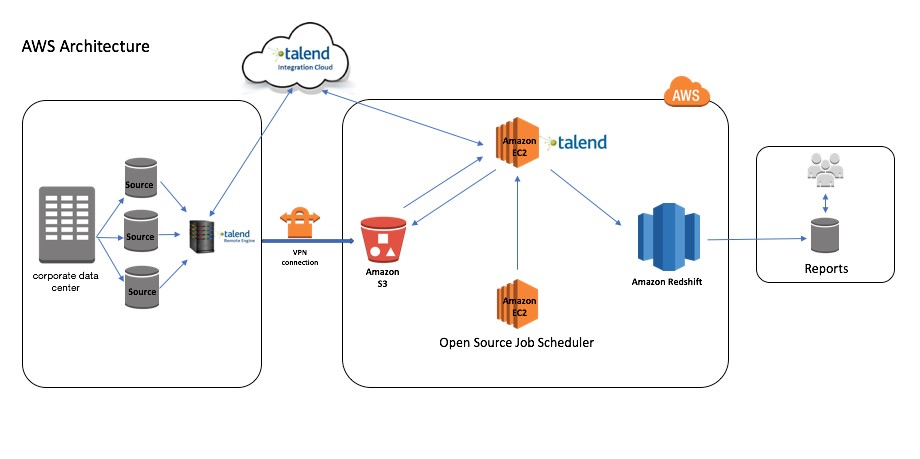
While the other tools focus on collecting and visualizing data, Amazon Redshift is a data warehouse. However, it is an extremely useful tool for analyzing massive amounts of data, making it popular amongst major enterprises and chains. Part of its popularity comes from its versatility. Redshift can be used for business intelligence, predictive analysis, analytics reports (pictured above), and more. It integrates seamlessly with other Amazon services, such as the AWS analytics ecosystem, Kinesis Firehose, and most importantly S3. That means that Redshift is an excellent option for applications with a powerful AWS backend. If you need to query massive data lakes and analyze a lot of data fast, explore Redshift.
MixPanel
MixPanel is a retention-focused analytics tool that offers several different free and paid pricing plans, each with their own features. Notably, MixPanel does not just track the data; it uses several data analysis techniques to estimate why changes take place in the first place. Though this feature is not unique to MixPanel, its hypothesis feature and notable A/B testing streamline the process.
While MixPanel is extremely useful for user acquisition and retention, it lags behind in other areas. Nevertheless, if your company wants to focus on analytics efforts on user testing and satisfaction, MixPanel is a wonderful choice.
What to Track
Every user interaction has so many variables that it can be difficult to choose the most important ones. Each one indicates an entirely different set of information that could be extremely valuable or completely useless. The secret to great app analytics is to identify the right key performance indicators, or KPIs. A KPI is a measurable variable that can be used to evaluate the success of a business goal. By carefully selecting the right KPIs, your team can track exactly how users feel about certain changes. The possibilities are limitless, but some KPIs stand out as particularly useful. The best choices depend on the information you want to collect.
User Profile Information
Strategic data analysis is one of the most effective ways that a company can learn how its users behave. As a result, most app analytics tools are well equipped with all sorts of features that make collecting user data easy. However, if you don’t know what to look for, your data isn’t as useful as it could be. Here are some important KPIs to watch out for.
Demographic KPIs
Each user is unique, so collecting defining information about each one helps you solve bugs and understand your audience. Here are some important demographic KPIs.
- Location
- Age
- Gender
- Language
- Device Type
- Operating System
- Carrier
Event KPIs
Every time a user interacts with your app in an important way, such as making a purchase, you should find out the details. These KPIs help you collect information on important events.
- Installs/Uninstalls
- Launches
- Registrations
- First Purchase
- Upgrades/Downgrades
- Subscriptions/Unsubscriptions
User Behavior and Satisfaction KPIs
If you want people to keep using your app, you need to know if they are happy. In fact, user satisfaction statistics KPIs are arguably some of the most important variables to track. Here are some of the most important ones.
- Time of Use
- Clicks
- Session Interval
- Session Depth
- Screens per Visit
- Retention Rate
- Daily Active Users (DAU)
- Monthly Active Users (MAU)
- Stickiness
- Shares
- Churn
Sales and Finance Information
Whether you’re developing an app to sell products or to build brand awareness, your business can be bolstered with thorough app analysis. Of course, the KPIs that your company should prioritize depend upon your unique business goals. However, here are some of the many KPIs you should consider tracking.
Costs and Revenues KPIs
Your company keeps track of all the money it spends and receives, but does it track how much value it gets in return? To make those critical business decisions more effectively, evaluate these KPIs:
- Return on Investment (ROI)
- Time to First Purchase
- Average Revenue per User (ARPU)
- Customer Lifetime Value
- Customer Acquisition Cost (CAC)
- Cost per Install (CPI)
Advertising KPIs
Whether you are advertising your app or including ads in the app itself, you must keep track of each advertisement’s effectiveness. Here are a few handy KPIs to monitor.
- Installation Source
- Effective Cost per Mile (eCPM)
- Organic Conversion
- Click-Through Rate (CTR)
- Return on Ad Spending (ROAS)
- Conversion Rate (CvR)
- Cost per Conversion (CPA)
App Store Optimization KPIs
Every good web developer optimizes their websites for search engines, but not every app developer considers the importance of App Store Optimization. Keep track of these metrics to make sure people are organically finding your app.
- Keywords
- Category Rank
- Views to Installations
- Ratings
- Reviews
- Review Quality
Performance and Bug Information
No app is 100% bug-free. No matter how airtight your QA process may be, users will still encounter errors. But if your app does not include a means of tracking these bugs and errors, people will stop using it. For the sake of the longevity of your application, keep an eye on how well it functions.
Performance KPIs
Is your application as effective and efficient as possible? More likely than not, it could use some performance enhancement, especially as a user’s device grows older. Keep track of these KPIs to make sure your app performs up to speed.
- Load Time
- API and Carrier Latency
- Uptime
- Devices and OS
Bug Tracking
Users will always find new and innovative ways to break your application. Keep track of support tickets and error and crash reports at all times to make sure your app works as well as possible.
Making Changes Based on Analytics
Align Your KPIs With Your Goals
Your application will change over time, so why should you constantly track the same variables? Focus on different KPIs each time you create a new business goal. For instance, if your goal is to get more users, focus on specific events, such as installs and launches. If you want to keep users, focus on KPIs like churn and MAU. By tying your goals to specific measurable variables, your goals become easier to achieve.
Map Out Processes
Once you figure out the specific variables that need to change to meet your goals, map out the related processes. For instance, if you want to decrease the time to purchase, map out every single step a user needs to go through in order to make a purchase on your app. Because Fyresite maps out every step of every process before beginning development in the first place, this part of the analytics process is easy. Just follow the user flowchart.
Run Tests and Experiments
After you thoroughly examine how user behavior relates to the specific KPIs you want to improve, formulate a hypothesis. For instance, a game application may hypothesize that users who beat three levels are less likely to uninstall the app. Similarly, an eCommerce app may hypothesize that users who browse a certain number of listings will purchase a product more quickly.
Once you have a hypothesis, start testing it against your data. The goal of this phase is to find patterns in the data and react accordingly. If the data verify your hypothesis, reframe it into a goal. If the gamer app discovers that users are less likely to uninstall the app if they play more levels, they may reframe their goal to be “get users to play more levels.” Through experimentation and comparison with your data, you can create new goals and understand what your users want.
But all of these benefits are contingent on accurate data. By not tracking data properly, you will miss out on massive business opportunities. If you need better analytics in your custom-built mobile application, reach out to us online or call us at 888.221.6509.

