 Reed Steiner
This blog has been updated to reflect the most recent statistics as of November 2023
Have an idea for the next big app? Be careful. It’s probably going to fail.
After all, 99.5% of consumer apps fail.
Shocked? We were too.
It’s a scary number, but you can’t fight the truth. Trust us: we tried.
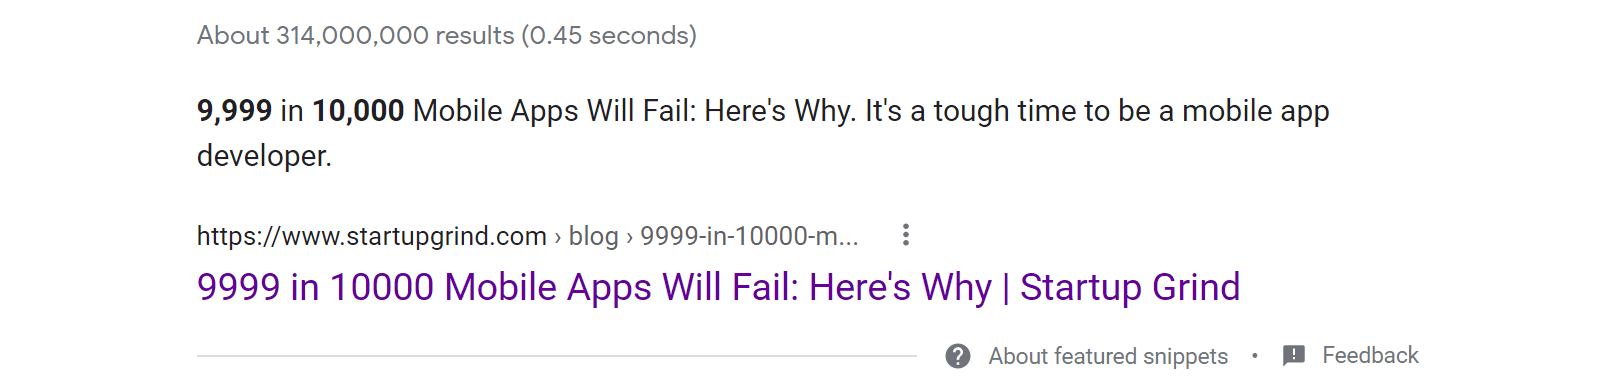
After examining statistics like “9,999 in 10,000 apps fail,” we set out to prove them wrong.
We did, but is 0.5% better?
App success and failure is nuanced. Many factors can make or break your app. That’s why your friends at Fyresite have written this blog to show the numbers and debunk myths.
Using our guide can help you become part of the .05%.
Schedule a consultation with us today to go over your app needs!
Only 0.5% of Consumer mobile apps succeed
That’s right – only 0.5% of consumer apps succeed.
It’s not 50%, nor is it 5%. It’s 0.5%.
Why so low?
Because it’s really hard to make any money with them.
Why?
First of all, most apps don’t have product-market fit. No matter how good an app is, it needs a market to sell in.
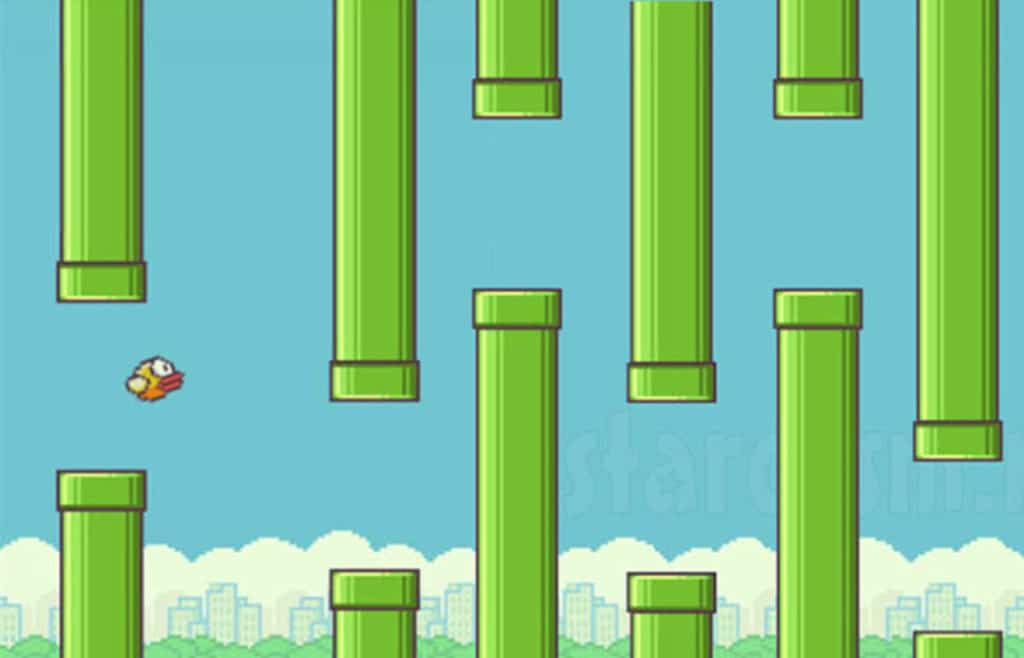
Markets are fickle. Remember Flappy bird? Apps require constant time, energy, and money, or the public forgets about it.
Consumer apps need lots of marketing. The app store is full of apps with great ideas but no budget to market them.
They’re also expensive to build. Read our breakdown of how much building an app costs here.
Apps also need a good business infrastructure to succeed.
About 13% of B2B mobile apps succeed
Business apps have a few advantages that help them be more successful.
Businesses are already starting with capital, revenue, and product-market fit. Often, the business needs the app to remove a cost, not to make more revenue. Business teams also know about the power of marketing and strategy.
That’s why business apps tend to do better – success isn’t dependent on profit.
But business apps have their own issues.
Bureaucracy can make a business far too slow to develop an agile app. Some businesses are out of touch with employee or customer needs, and their app is redundant.
Customers get frustrated when emphasis is placed on business metrics instead of user experience. And sometimes, the app just doesn’t succeed.
Of course, these stats vary from industry, ideas, and many other factors.
But in general, apps are high-risk, high-reward products. After-all, 99.5% of consumer apps and 87% of business apps will fail.
What about the 0.01% statistic?
People say that 9,999 out of every 10,000 apps (99.99%) fail, but it’s not true.
In fact, it’s pretty easy to disprove.
That’s a pretty narrow definition of success.
So why does everyone think so many apps fail?
How the myth started
This stat pops up often when you Google “how many apps fail”, but it’s not accurate. In fact, it’s pretty easy to disprove.
As of November 2023, there were over 3.6 millions on the Google Play store (from about 1.2 million publishers). Based on 0.01% success stat, only 360 Google Play apps would be considered successful.
So why is the myth so prevalent?
How the Myth Started
When you google “how many apps fail,” you see the same statistic, .01%. This was taken from a study out of context.
The original source of this statistic is this 2014 report from Gartner, Inc: a major research firm and member of the S&P 500.
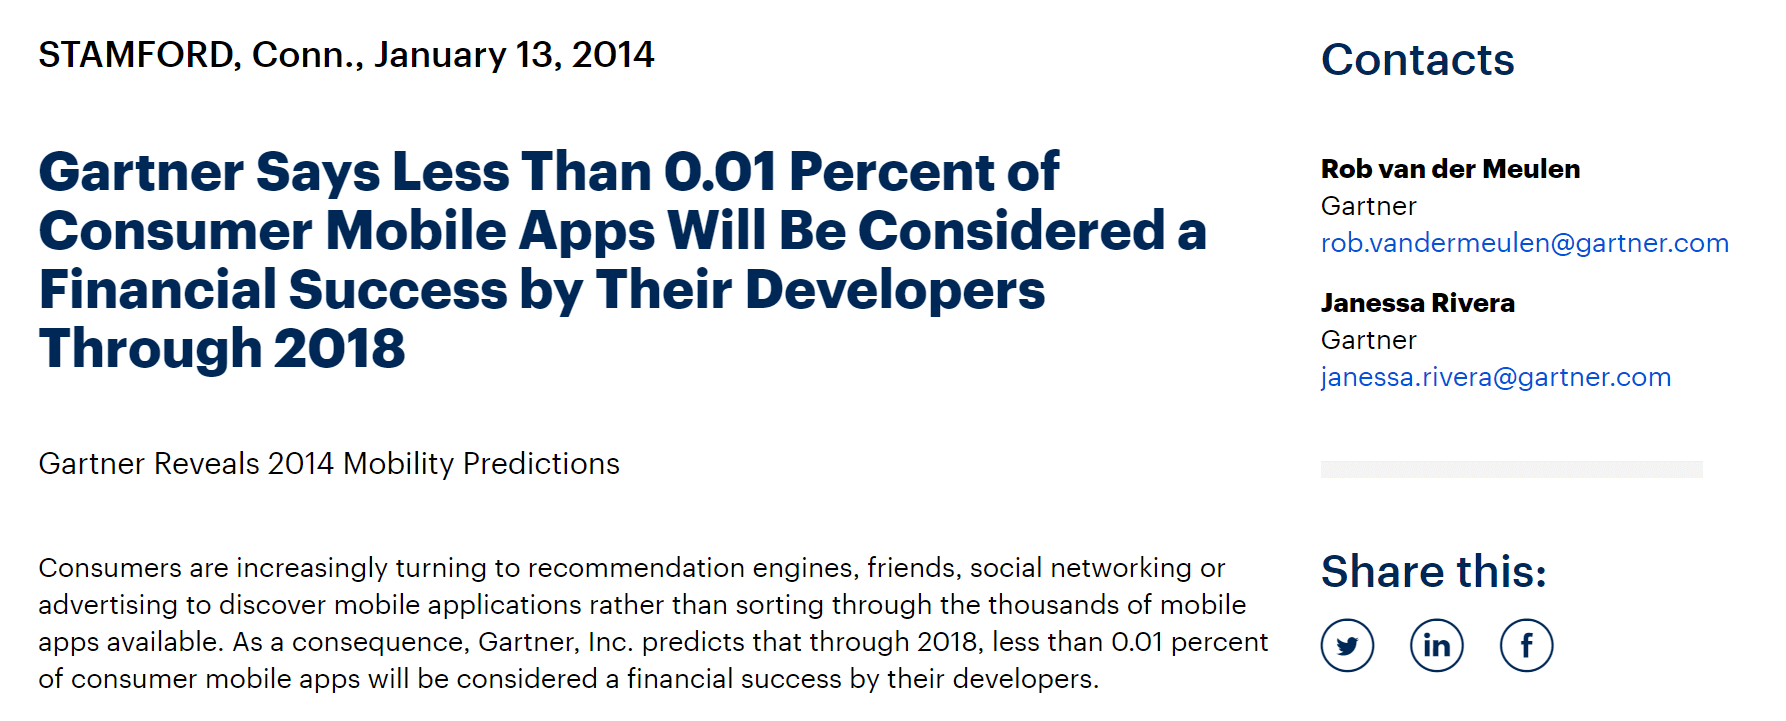
Gartner is making a rough estimate that most consumer app developers won’t make as much money as they expect.
It’s a pretty reasonable guess: everyone thinks they’ll be in the top, but that’s not always a realistic goal.
This didn’t stop people from panicking about the number without context. Here’s the context you need.
Gartner is only talking about consumer mobile apps (which are notoriously unsuccessful), not all mobile apps, and are defining app failure only by financial failure. Brand-building apps are successful without making money (a distinction Gartner makes clear).
This number is based on 2014 data and the predictions that cross-platform frameworks and free-to-install apps will flop.
Gartner never claimed that nearly every app fails. Instead, they looked at the 2014 app landscape and warned amateur developers to not assume apps were a sure way to make money.
But we still need an accurate number. Enter Fyresite.
Debunking the Myth
App success is defined differently by app type, making the numbers murky.
Some apps define success as financial success, brand awareness, obstacle removal, or with displaying and organizing data.
With so many definitions, there was no one way to determine the success of all apps. To find our magic number, we used multiple methods.
Step 1: Interviews
First, we interviewed dozens of industry professionals to get their viewpoints.
We also got valuable input from the Fyresite team. Since we work with apps every day, we have first-hand knowledge of what works and what doesn’t.
This was mostly qualitative research, used to see where we should look next.
Result
“It depends,” was the most common answer. An amateur coder’s consumer app with no market research will almost certainly fail. However, an automated business process has better chances of success.
What This Means
These interviews aligned with the data: most smaller, inexperienced projects will flop. It also showed on average, the longer the app persists, the more successful it is.
Limitations of This Method
Interviews give us anecdotal evidence. They only show us a small piece of the whole puzzle.
What We Learned
We learned app success and failure is multi-faceted, and where we should look to learn more.
Step 2: Industry Comparison
Apps are a type of business, so we looked at US Bureau of Labor Statistics data presented by Lendingtree for comparison.
Results
20% of small businesses fail in the first year, 50% fail by the fifth year, and 66% of businesses fail by the 10th year.
What This Tells Us
Most small businesses don’t last ten years. This seems grim until we look at the bigger picture.
After year 1, an additional 30% of the original business population goes away. That means only 7.5% of the original business population fails each year after year 1.
It gets better after that. After year 5, only 16% of the original business population goes away over the next five years. That means only 3.2% of the original business population goes away for the next five years after year 5.
In other words, the longer you last, the more likely you are to survive.
Limitations of This Method
Apps aren’t directly comparable to small businesses. Apps have a very high startup cost, very low personalization, and very high competition. Apps also can be made inside bigger businesses.
This data maps an overall trend, and it varies within industries. We expect the pattern to be similar to apps, but the exact numbers will differ.
What we learned
Finally, we looked at data to determine how many apps fail. We focused on 4 key indicators – ratings, installations, user retention, and financial data.
Ratings
The number and quality of ratings can indicate success. We used Android Rank’s data pulled from the Google Play store for this metric.
Installations
The number and quality of installations indicate success. We used Android Rank’s data pulled from the Google Play store for this metric.
User Retention
Apps need to get and keep users for continued success. We used Andrew Chen’s Quetta data and Statistia’s Google Play and Localytics data for this metric.
Financial Data
A successful app either saves money or makes money. The break even point is a good way to measure whether an app succeeds or not. We used survey data from App Promo and data from SurveyMonkey Intelligence.
Step 4: Analysis
Now that we had the data, we needed to analyze it.
Splitting the apps
Enterprise and consumer apps needed to be measured separately. App success is measured differently by type, so we needed to separate them for accuracy.
Consumer apps have a lot of variation, but they have similar goals. A brand awareness app still needs lots of downloads, even if profit isn’t as important.
Authenticating Metrics
We first looked at ratings to determine success, but it wasn’t perfect.
The Android Rank data showed that of 305,378 apps with over 100 ratings, over 187,000 apps are rated above 4 stars (about 61%).
But high ratings don’t always mean a successful app. Vine was well-liked, but still shut down.
Plus, ratings aren’t always honest. TikTok’s ratings plummeted to 1.8 stars until 8 million reviews were deleted. Then, the ratings jumped to 4.4 stars.
We needed to look from a different lens. We decided to define failure instead of success.
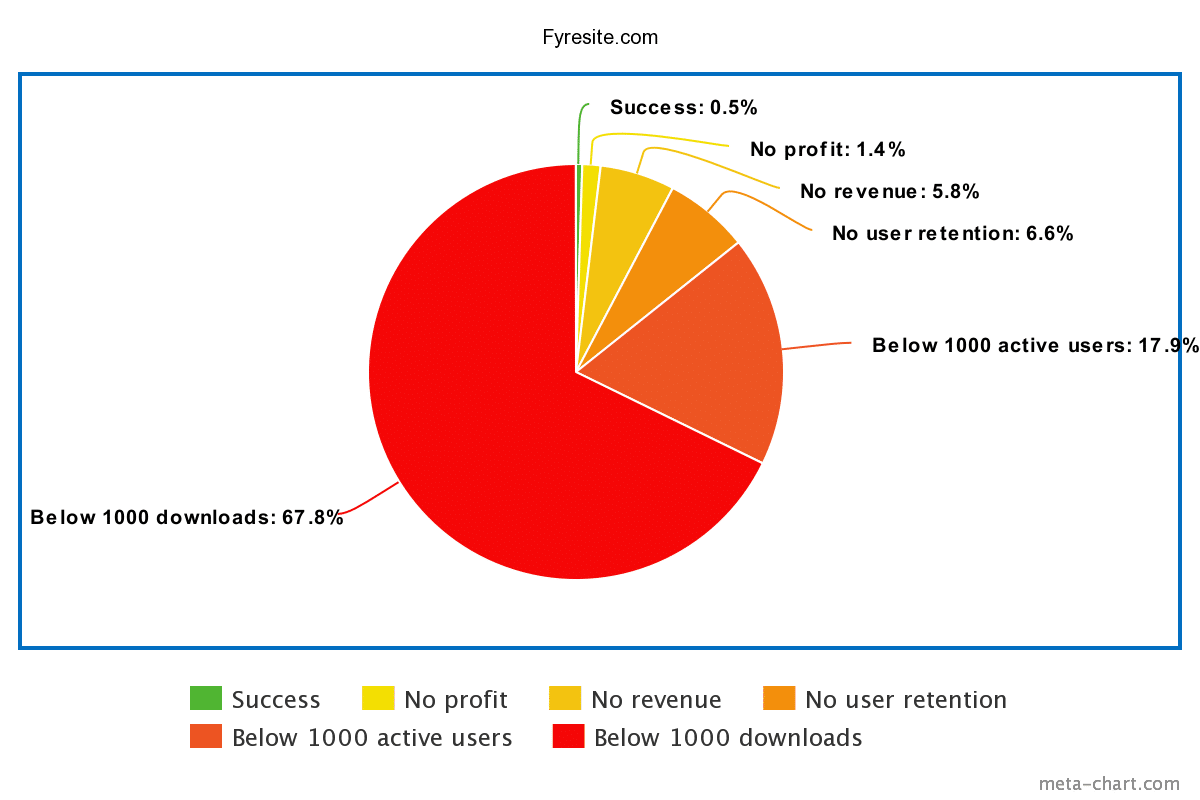
Initial sample of failed apps
First, we determined how many apps received below 1000 downloads. Apps can succeed with fewer than 1,000 downloads, but the first 1,000 users are a staple metric.
This eliminated most apps. Statista’s Google Play statistics reveal that 68.07% of apps never hit the 1000 download mark.
This number roughly aligns with other data, such as App Promo’s discovery that 67% of developers don’t break even.
The graph is especially revealing.
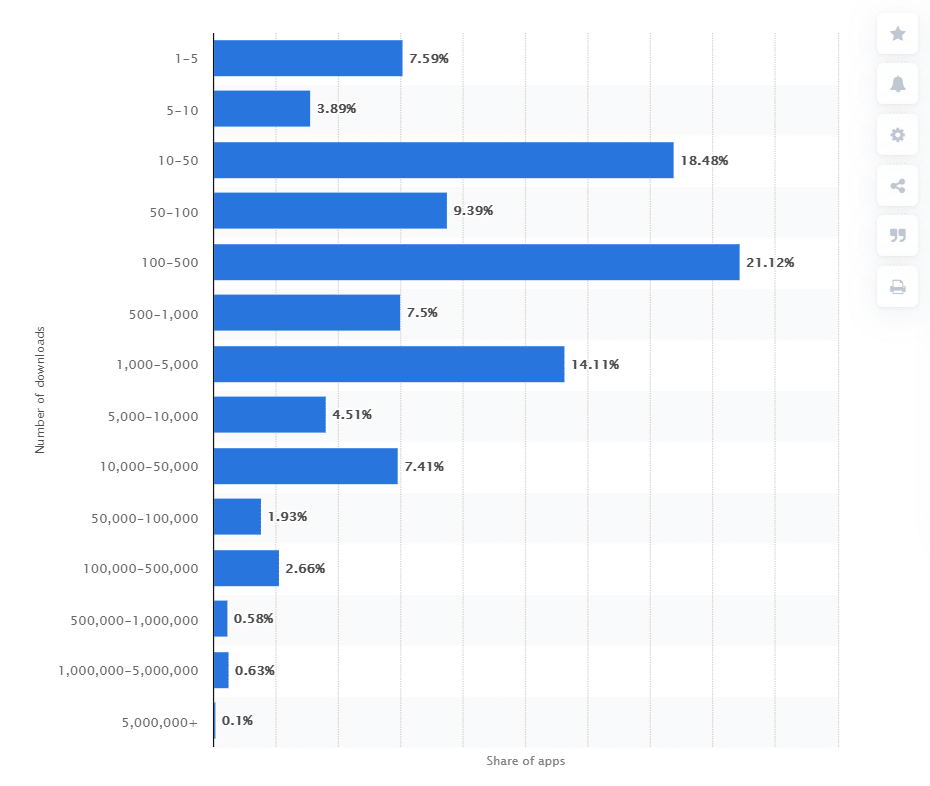
Downloads form a bell curve scrunched toward the failure side of things, revealing that by this metric, most apps do fail.
The majority of apps receive 100-500 downloads, and very few apps will ever move far beyond that threshold. And 1000 downloads are not a success if you can’t keep them.
Narrowing the Sample with Retention Rate
After removing most consumer apps that never get enough downloads, we accounted for user retention.
We used Chen’s data from this post, as graphed below.
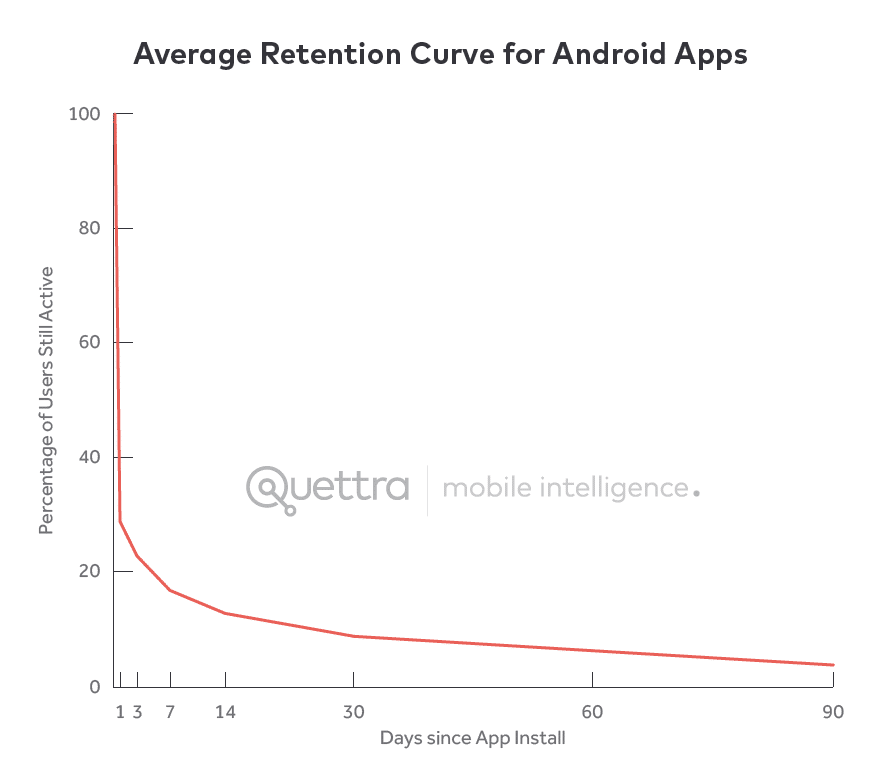
In three days, 77% of users leave. After three months, 95% of daily active users are gone.
This information is extremely useful because it explains why so few apps succeed. They get a spike of traffic, then lose almost all of it over the course of a few months.
The graph explains why so many apps don’t have sustained traffic. It also casts doubt on installations as a metric: an app with 10,000 installations may not maintain them. But it’s not all gloom.
If apps maintain a steady stream of new installs, new users replace the old. After the first three days, most old users have already left, leaving 5% of the original installers. That’s higher than the eCommerce conversion rate of ~2%.
Essentially, it means that if you can hold on past the first wave of departures, you’re much more likely to survive. But retention curves aren’t constant.
Adjusting Retention Rate Based on Popularity
The more popular an app gets, the less likely people are to leave. Retention rates are higher in the top 150 apps than any others, as graphed below.
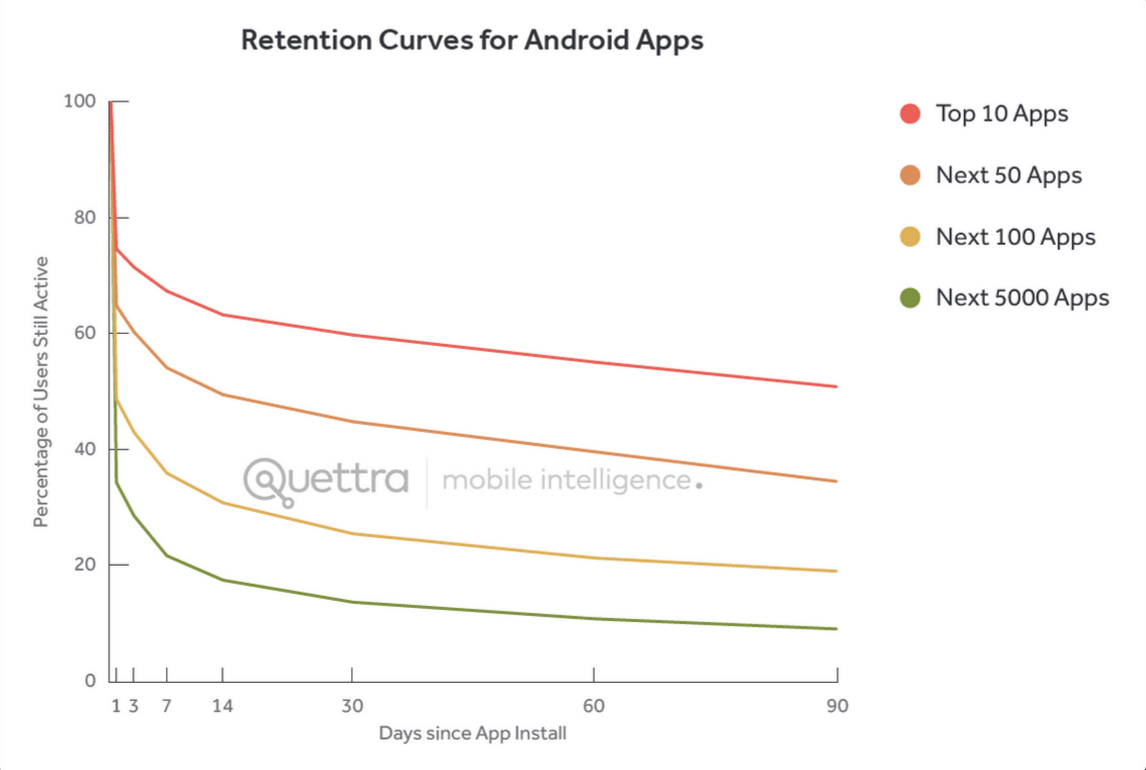
The top 150 apps only lose 20-60% of users in the first three days and 40-80% in the first three months. Note that only the curve for the top 10 apps flattens out pretty high up. The rest trend toward zero.
This information reveals two important points:
If you don’t get more users, your app will fail, and more popular apps last longer.
It also explains why App Promo discovered that successful app developers spend $1000+ per month marketing their app. They need more users to replace the old ones.
Thus, for an app to survive, it must do one of the following: either keep new users coming in to replace the old, or engage users to reduce the drop-off rate.
Only about 13.9% of apps will have 1,000 users after 3 months according to the above data. But they still need to engage users. We estimate that only 7.3% of consumer apps will survive past the first three months.
With a good funnel and engagement strategy, users can be replaced. Here is an example from Clevertap.
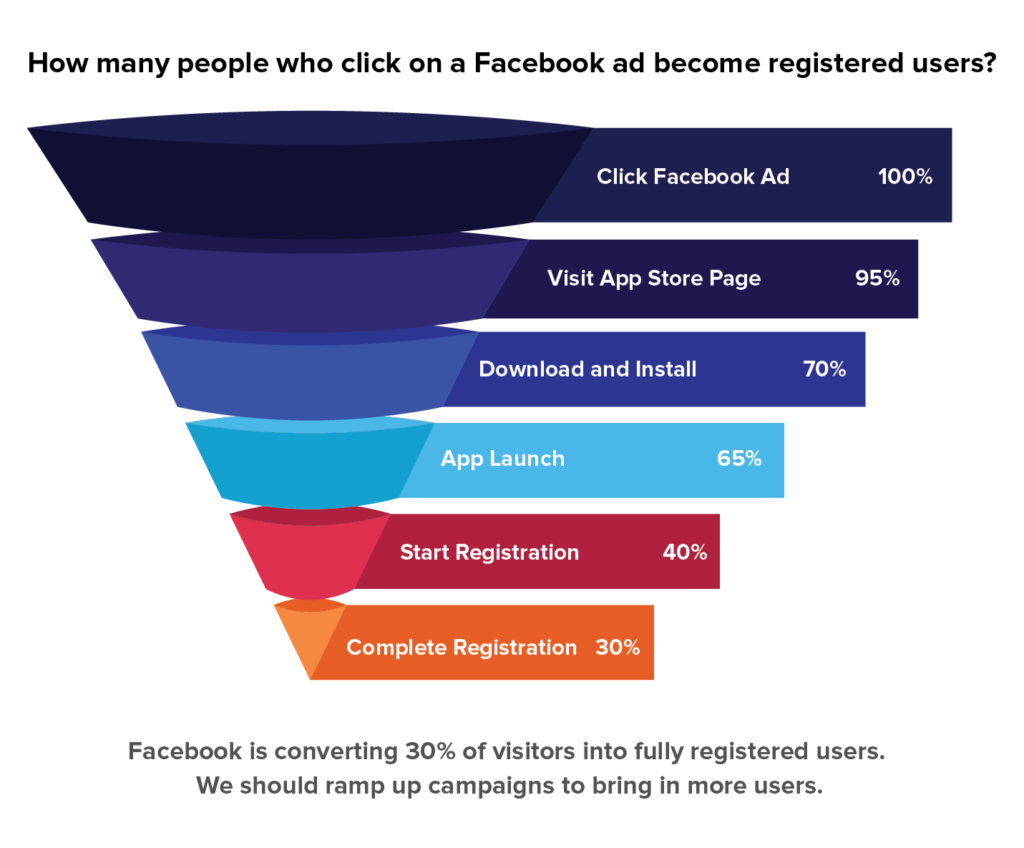
Using ads can increase conversion rate, but it’s not an option for every business.
That funnel costs money. Many apps don’t have an ad or even marketing budget, and apps without the budget won’t do as well.
And it gets worse when you consider the financial side of success.
Calculating Financial Success
While not the goal for all apps, very few will financially succeed. Consider Survey Monkey’s data, average revenues are warped by the top few apps.
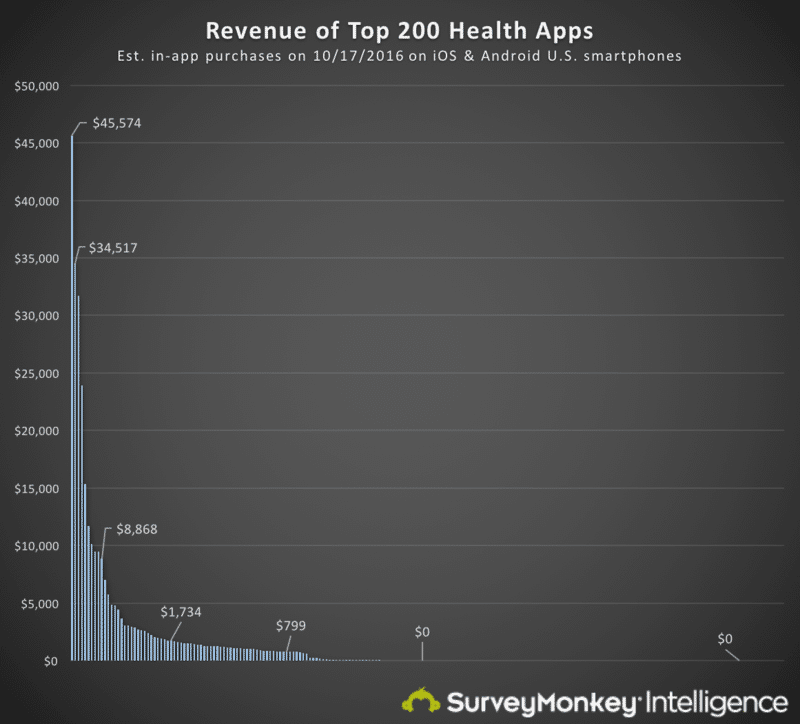
The average revenue for a health app is $1500/day, but the median revenue is zero dollars.
Why? Because most apps don’t make money. Within any given category, only the top 20% actually make money.
Take a look at this graph of daily revenue.
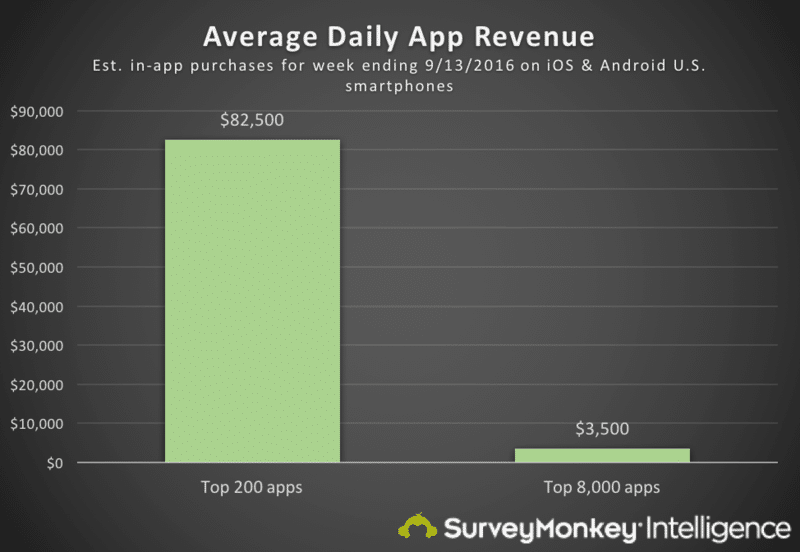
The top 200 apps make 23x more than the next 8,000 combined.
If you define financial success as getting into the top 200 apps, you have a 0.00007% of succeeding. To make it into the top 8,000 apps, that goes down to 0.003%.
This doesn’t tell the full story. The industry numbers say only the top 20-40% actually makes money.
That means only 1.46% of apps will have any revenue at all.
Of course, this is only measuring money made from the app. Some businesses will have apps that generate no revenue, but are a net positive from the money they save from using the app.
Breaking Even
For financial success, you have to make money, or break even.
And that’s hard to do. App Promo illustrates it in the below infographic.
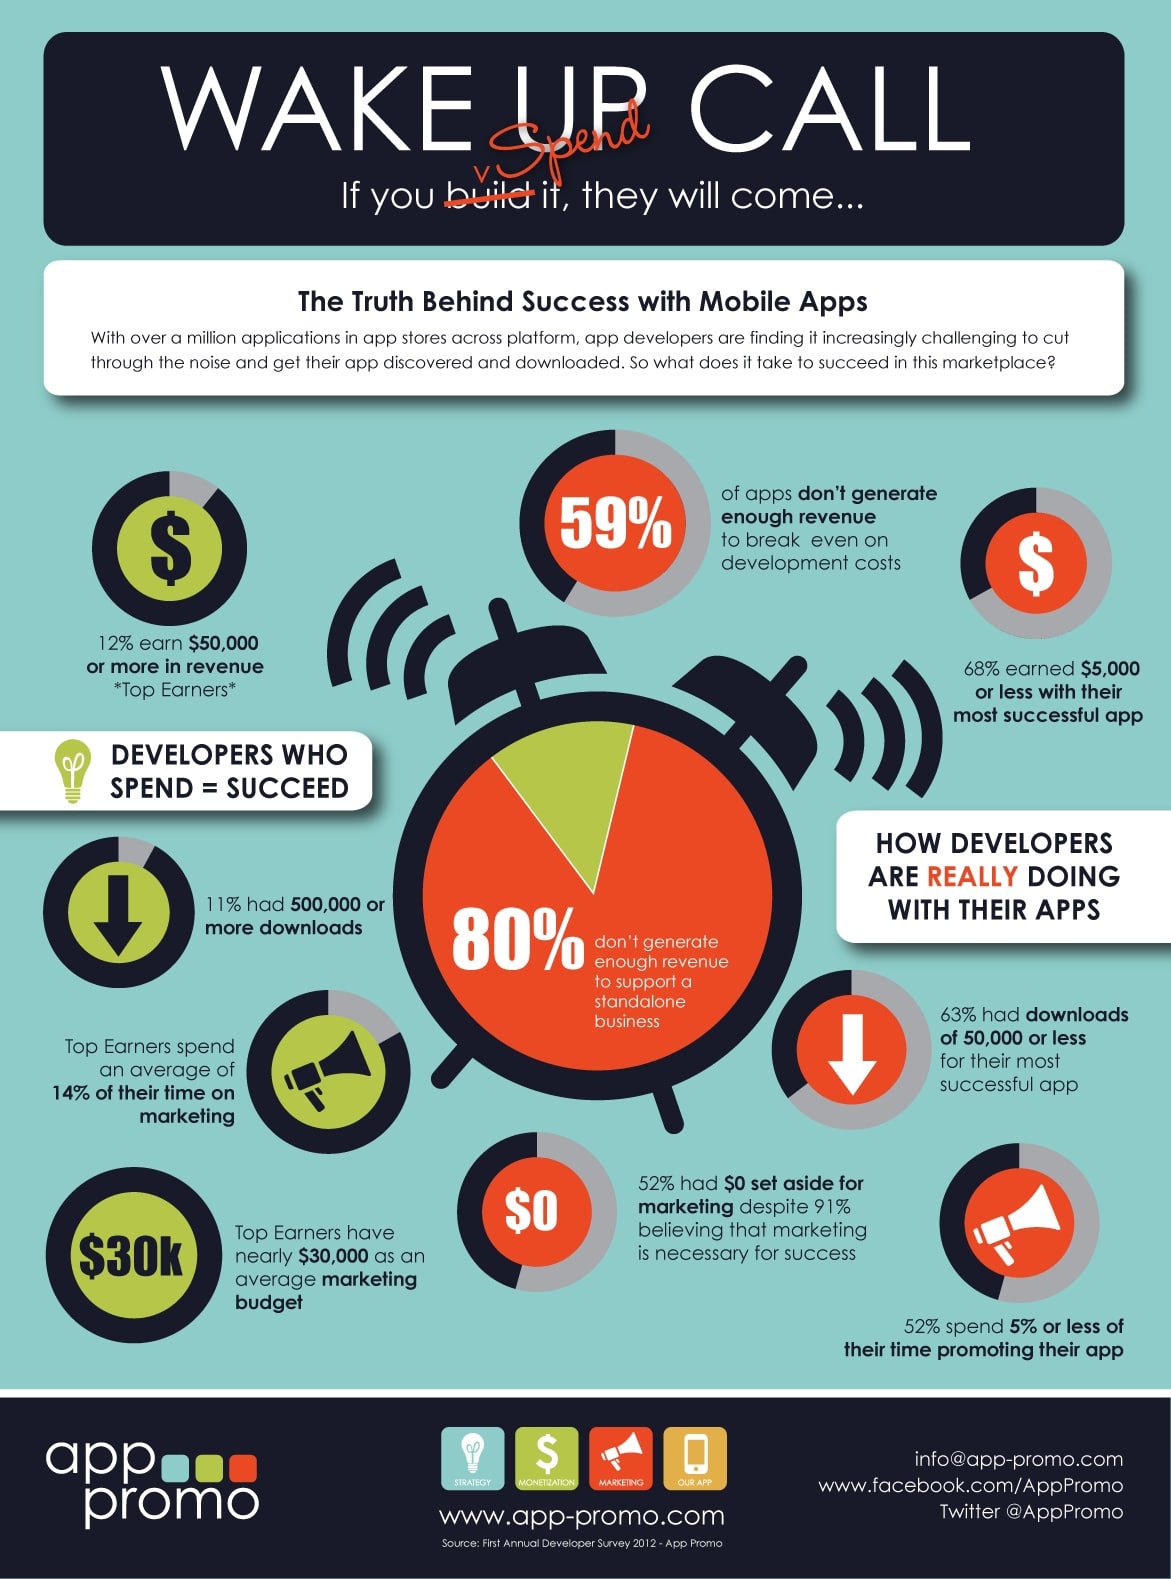
Note: This 80% statistic represents only those surveyed, who are more likely to have a successful app. Our data uses app store data and includes apps too small to make it into the survey.
To make money, you have to spend money. Lots of it.
This is what stops many from breaking even.
Based on this information, we estimate that only about 0.5% of these original apps will break even.
Adjusting for B2B
Most B2B apps have a much higher chance of succeeding. Why?
Their goal is to solve an internal blocker. Once it’s solved, the app succeeds and the company makes money. Plus, companies are almost always far more strategic than the 80% or so independent developers that build consumer apps, and have larger budgets.
Most importantly, a business already has the infrastructure that keeps an app alive.
Because this infrastructure exists already, it’s less likely to fail. We estimate that about 13% of B2B or internal apps succeed, versus an estimated 0.5% of consumer apps.
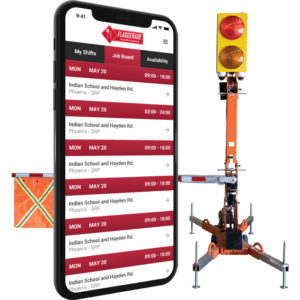
This is a huge difference, but it makes sense. Consider business apps like Flaggerade (read how we built Flaggerade for more details). Flaggerade is a shift management and automation app for one of the biggest road sign and work zone companies in Arizona. It succeeds by making an internal process more efficient, not by bringing in more revenue.
An internal app like this pretty much succeeds by default. Business often eliminates a problem that costs money, instead of having to find that money to begin with. Even if they don’t, they have the necessary business infrastructure to survive.
Consumer apps have more work to do. On top of app creation, they also have to find the product market fit, customers, build their infrastructure, and get the funds for the app and marketing. Consumer apps have to generate revenue, and have less wiggle room for failure and quality testing.
The Hope
There is. A 0.5% success rate seems scary, but it’s not a prophecy.
We’ve made some important discoveries about why apps die. Your app can succeed if you take the right steps.
We’ve gone over what you need to make a great app. You need to find product-market fit before you build anything, build a solid business infrastructure, and invest in your marketing.
Most importantly, remember the “Great Filter.”
The Great Filter
The Great Filter is a suggested reason that we haven’t found extraterrestrial civilizations, saying there are filters a planet must pass through for the development of life.
Earth has already passed the multicellular life and civilization filters. We don’t know what filters are ahead of us, but we do know that we’re further along than planets without civilization.
Apps are the same way.
Let’s look at that graph again to get an idea of what the filters are.
The biggest filter is the first 1000 downloads.
Once you have 1000 downloads, you’re better off than 67.8% of all apps.
That’s huge.
And once you hit 1000 active users, you’re better off than 85.7% of all apps.
That’s why it’s so important to find 1000 users before you build.
If you establish product-market fit, you’ve likely passed the first three filters. Then, you have to rely on your marketing to keep you there.
Notes on the estimates
0.5% isn’t a static number. Further research may reveal a number much higher or lower.
The math discussed in this post was used as an aid to help our expert designers and developers make an estimate, so there are some limitations to this research.
Reach out to app-building experts at Fyresite today to start your app!